
Paper List
-
Discovery of a Hematopoietic Manifold in scGPT Yields a Method for Extracting Performant Algorithms from Biological Foundation Model Internals
This work addresses the core challenge of extracting reusable, interpretable, and high-performance biological algorithms from the opaque internal repr...
-
MS2MetGAN: Latent-space adversarial training for metabolite–spectrum matching in MS/MS database search
This paper addresses the critical bottleneck in metabolite identification: the generation of high-quality negative training samples that are structura...
-
Toward Robust, Reproducible, and Widely Accessible Intracranial Language Brain-Computer Interfaces: A Comprehensive Review of Neural Mechanisms, Hardware, Algorithms, Evaluation, Clinical Pathways and Future Directions
This review addresses the core challenge of fragmented and heterogeneous evidence that hinders the clinical translation of intracranial language BCIs,...
-
Less Is More in Chemotherapy of Breast Cancer
通过纳入细胞周期时滞和竞争项,解决了现有肿瘤-免疫模型的过度简化问题,以定量比较化疗方案。
-
Fold-CP: A Context Parallelism Framework for Biomolecular Modeling
This paper addresses the critical bottleneck of GPU memory limitations that restrict AlphaFold 3-like models to processing only a few thousand residue...
-
Open Biomedical Knowledge Graphs at Scale: Construction, Federation, and AI Agent Access with Samyama Graph Database
This paper addresses the core pain point of fragmented biomedical data by constructing and federating large-scale, open knowledge graphs to enable sea...
-
Predictive Analytics for Foot Ulcers Using Time-Series Temperature and Pressure Data
This paper addresses the critical need for continuous, real-time monitoring of diabetic foot health by developing an unsupervised anomaly detection fr...
-
Hypothesis-Based Particle Detection for Accurate Nanoparticle Counting and Digital Diagnostics
This paper addresses the core challenge of achieving accurate, interpretable, and training-free nanoparticle counting in digital diagnostic assays, wh...
Revealing stimulus-dependent dynamics through statistical complexity
Universidade Federal de Pernambuco | University of Minho | University of Arkansas | Universidade Federal de Alagoas
30秒速读
IN SHORT: This paper addresses the core challenge of detecting stimulus-specific patterns in neural population dynamics that remain hidden to traditional variability metrics like the coefficient of variation.
核心创新
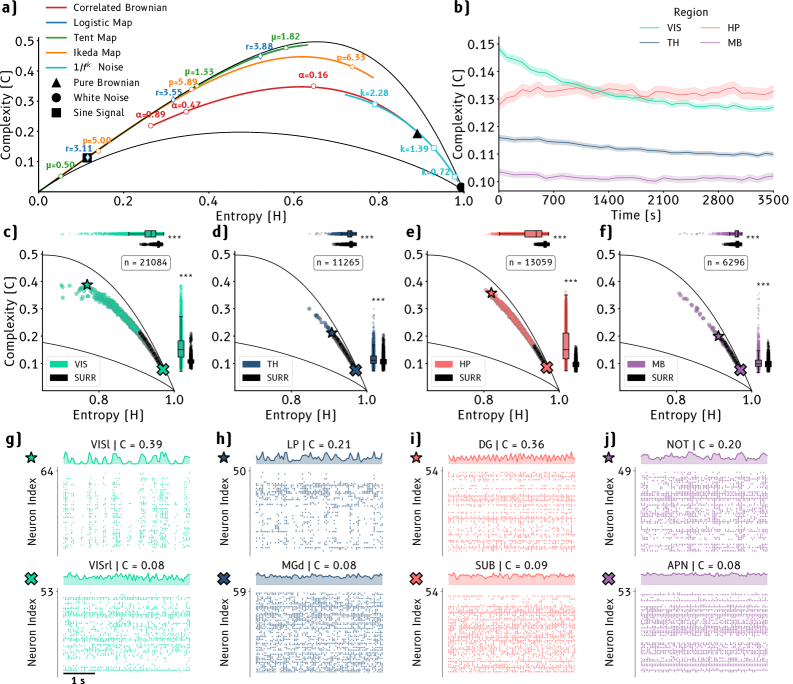
- Methodology Introduces the application of statistical complexity, an information-theoretic measure based on ordinal pattern analysis (Bandt-Pompe symbolization), to characterize the organizational structure of neural population dynamics across multiple brain regions.
- Biology Reveals a hierarchical gradient of stimulus-dependence: visual cortex dynamics are strongly modulated by stimulus conditions, thalamus shows attenuated modulation, while hippocampus and midbrain maintain relatively invariant dynamics, suggesting distinct computational roles.
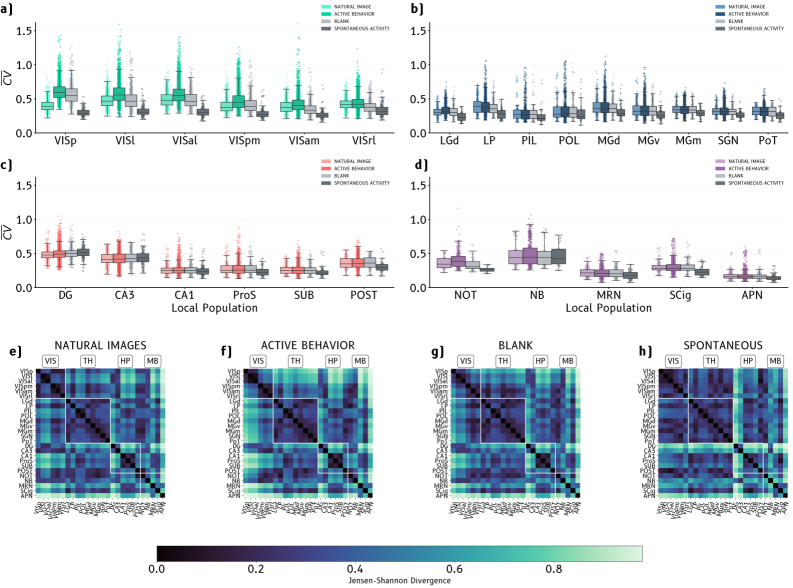
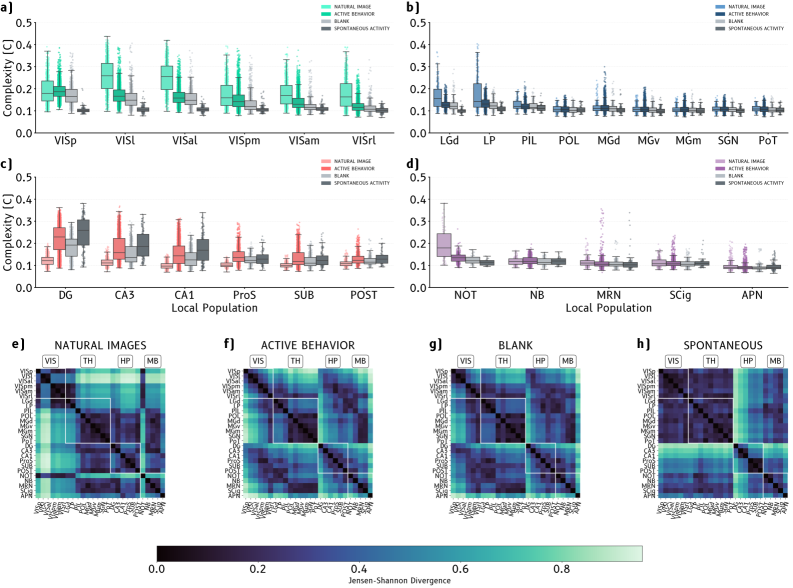
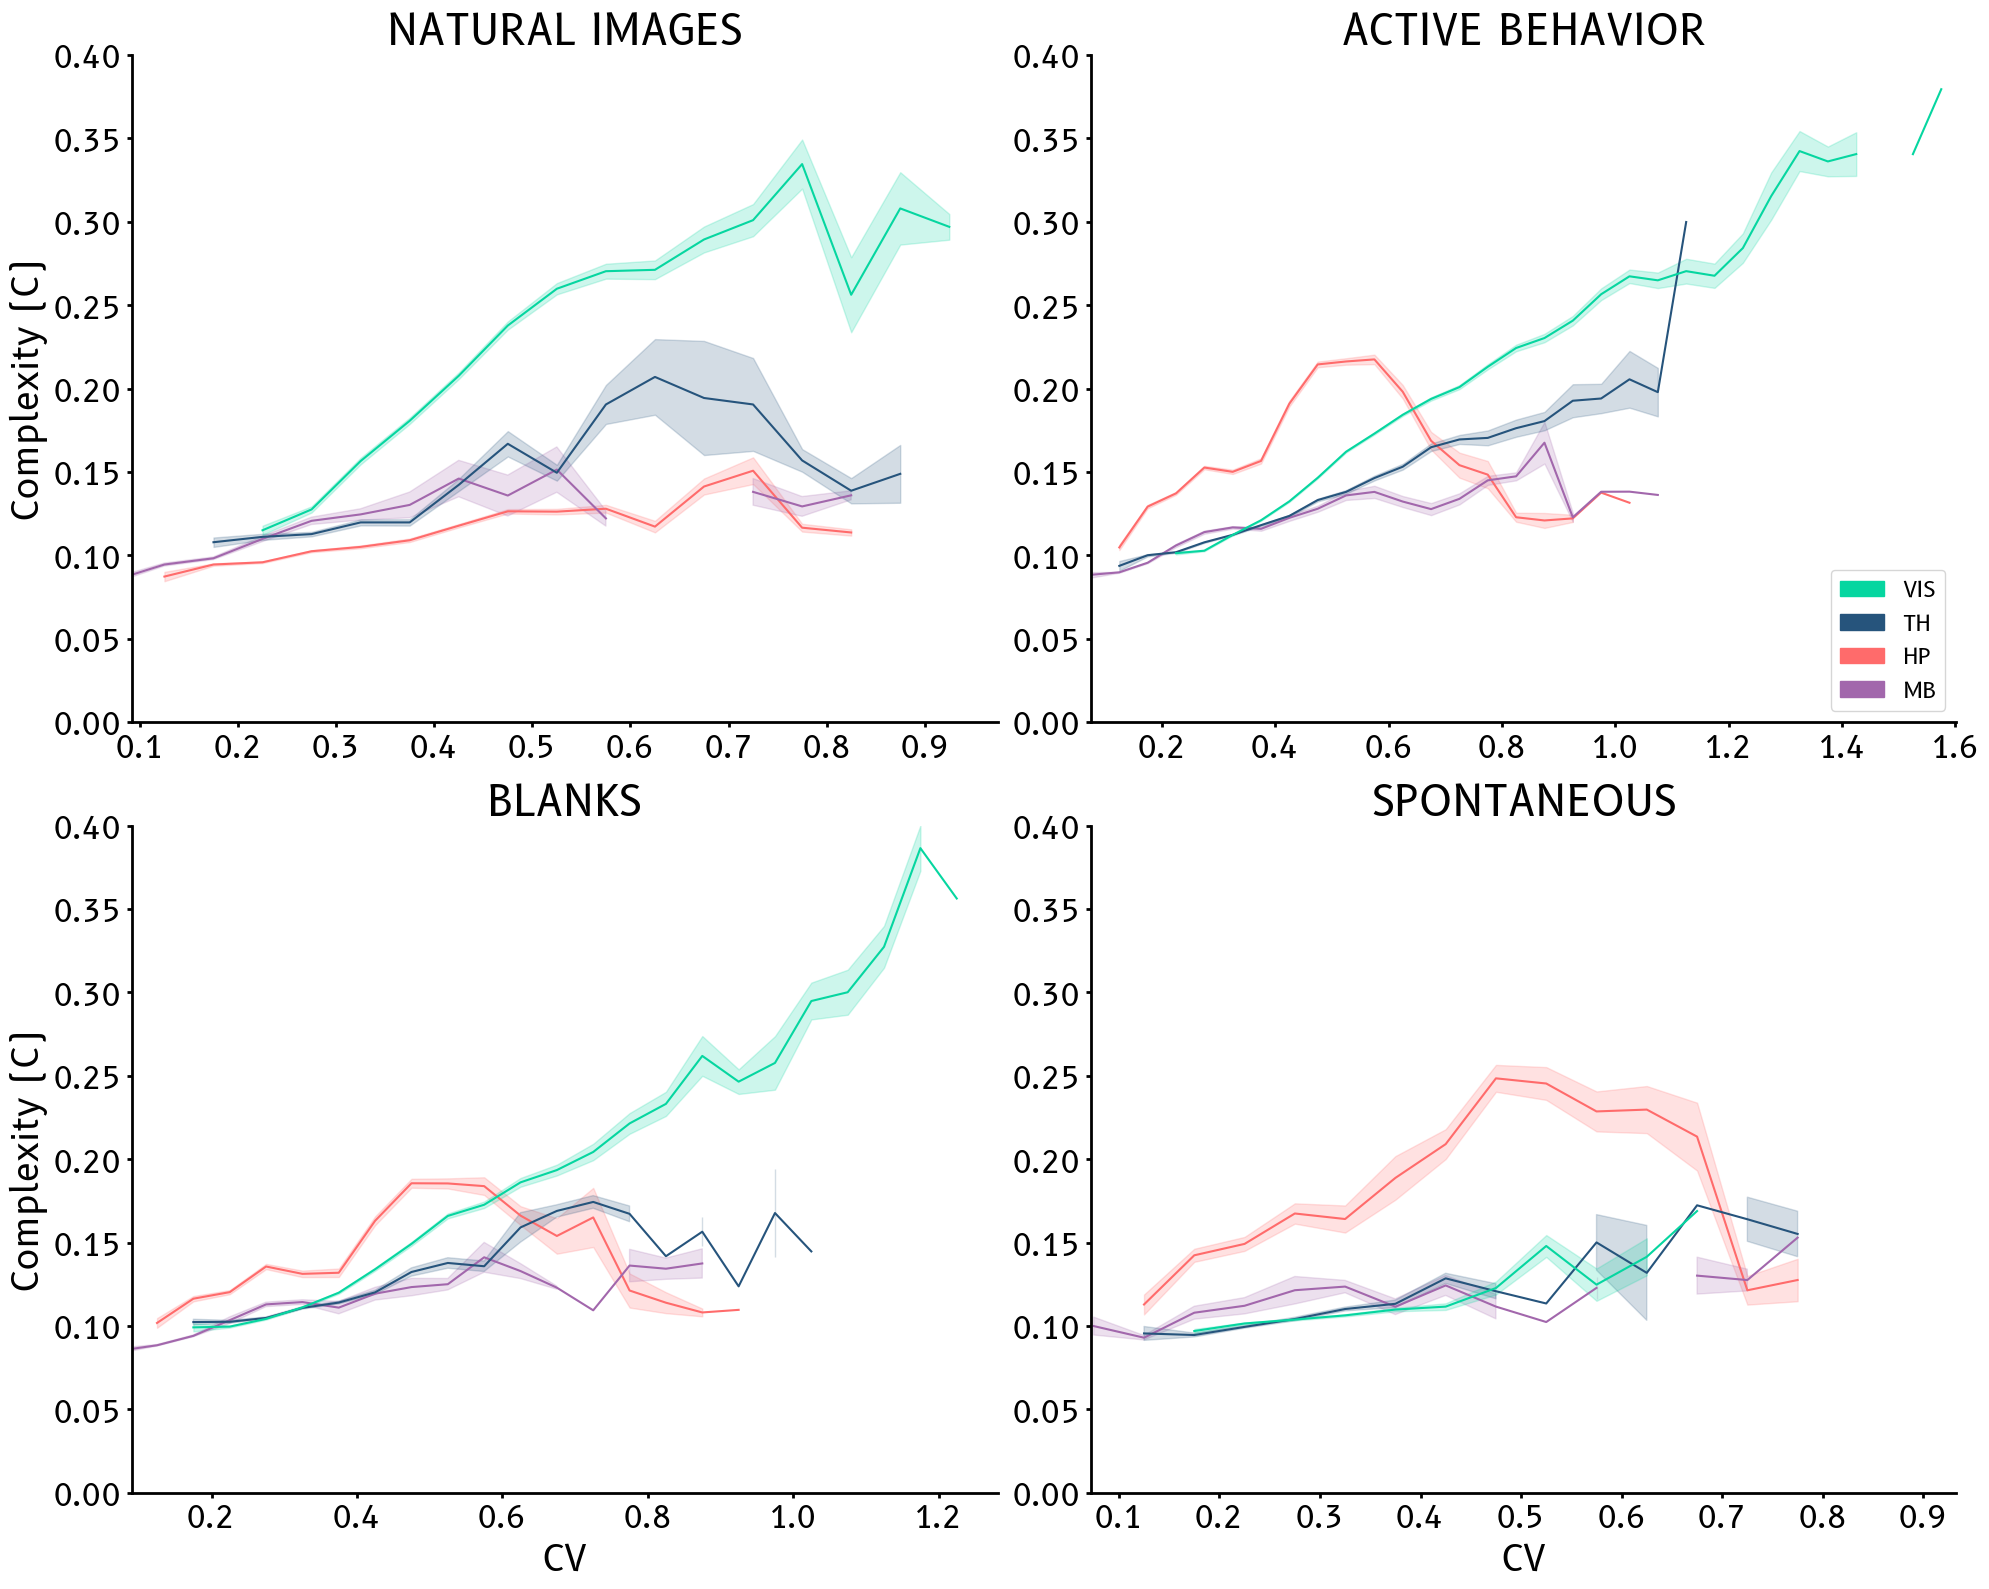
- Methodology Demonstrates that statistical complexity, but not the classical coefficient of variation (CV), can discriminate between different stimulus conditions (natural images, blank screens, spontaneous activity), uncovering structured motifs in population activity.
主要结论
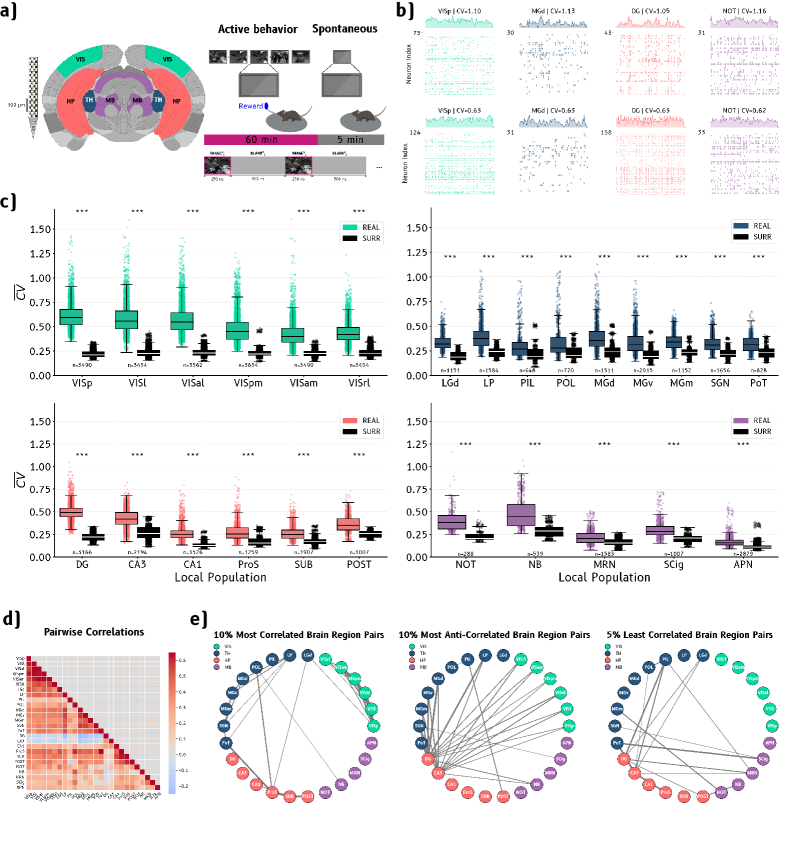
- Statistical complexity revealed clear, stimulus-specific motifs in population activity across visual cortex, hippocampus, thalamus, and midbrain, while the coefficient of variation (CV) failed to discriminate between natural image presentations, blank screens, and spontaneous activity conditions.
- Visual cortex subregions exhibited the highest CV values (median range: 0.40–0.59, approximately 2–3× higher than shuffled surrogates, p<0.001), showing strong stimulus-dependent modulation, while midbrain areas displayed the most invariant dynamics across all experimental conditions.
- The complexity-entropy (C-H) plane framework enabled classification of dynamical regimes, with different brain regions occupying distinct positions: visual cortex showed intermediate entropy with high complexity during stimulus presentation, while surrogate data clustered near the random limit (high entropy, low complexity).
摘要: Advances in large-scale neural recordings have expanded our ability to describe the activity of distributed brain circuits. However, understanding how neural population dynamics differ across regions and behavioral contexts remains challenging. Here, we surveyed neuronal population dynamics across multiple mouse brain areas (visual cortex, hippocampus, thalamus, and midbrain) using spike data from local ensembles. Two complementary measures were used to characterize these dynamics: the coefficient of variation (CV), a classical indicator of spike-time variability, and statistical complexity, an information-theoretic quantifier of organizational structure. To probe stimulus-dependent activity, we segmented and concatenated recordings from behavioral experiments into distinct time series corresponding to natural image presentations, blank screens during visual task, and spontaneous activity. While the CV failed to discriminate between these conditions, statistical complexity revealed clear, stimulus-specific motifs in population activity. These results indicate that information-theoretic measures can uncover structured, stimulus-dependent patterns in neural population dynamics that remain unobserved in traditional variability metrics.